

| Balanced market threshold | ~6 months of supply (National Association of Realtors general guidance) |
| Seller's market supply level | Under 5 months (Common industry benchmark) |
| Buyer's market supply level | Over 7 months (Common industry benchmark) |
| Key buyer's market signal | Frequent price reductions |
| Key seller's market signal | Multiple offers above asking price |
| Local vs. national data | Always check neighborhood-level stats (National averages can obscure local variation) |
The Three Market States, Defined
Every local housing market - and the national market as a whole - falls into one of three broad states at any given time. Understanding how a housing market works is the first step; knowing which phase it's in right now tells you what to expect when you sit down to negotiate.
Seller's Market
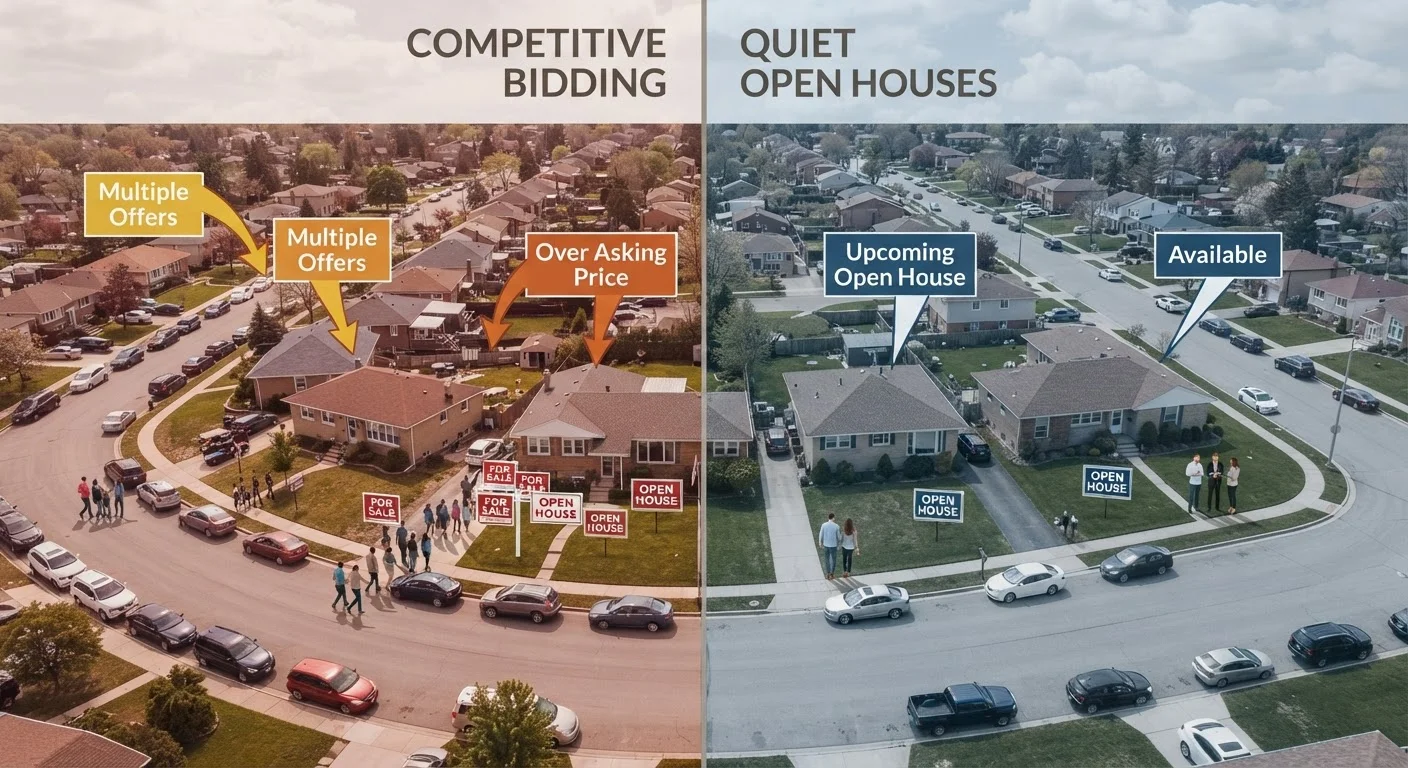
A housing market condition where demand from buyers exceeds the available supply of homes for sale. This typically results in rising prices, faster sales, and limited negotiating leverage for buyers.
Buyer's Market
A housing market condition where the supply of homes for sale exceeds buyer demand. Sellers may reduce prices or offer concessions to attract offers, and buyers generally have more negotiating power.
Balanced Market
A condition where housing supply and demand are roughly in equilibrium. Neither buyers nor sellers hold a clear advantage, and prices tend to rise modestly in line with broader economic conditions.
Months of Supply
A metric that estimates how long it would take to sell all homes currently listed, given the current monthly pace of sales. Six months is a common benchmark for a balanced market; below signals seller conditions, above signals buyer conditions.
Days on Market (DOM)
The number of days a property listing has been active before receiving an accepted offer. Low DOM typically indicates strong demand; high DOM may suggest overpricing or weak buyer interest.
List-to-Sale Price Ratio
The percentage of the final sale price relative to the original asking price. A ratio above 100% means the home sold above asking, a signal of competitive seller-market conditions.
- Seller's Market
- More buyers are competing for fewer available homes. Inventory (the number of homes listed for sale) is low relative to demand. Prices tend to rise, homes sell quickly, and sellers hold most of the negotiating power.
- Buyer's Market
- More homes are available than active buyers can absorb. Sellers may reduce prices to attract offers, homes sit on the market longer, and buyers can often negotiate concessions such as repairs, closing cost credits, or contingencies.
- Balanced Market
- Supply and demand are roughly equal. Neither party has a clear advantage. Prices rise modestly, homes sell in a reasonable timeframe, and negotiations tend to be more collaborative.
Real estate professionals often use months of supply - how long it would take to sell all current listings at the current pace of sales - as a quick benchmark. Roughly six months of supply is widely considered the dividing line between a balanced market and one that tilts toward sellers or buyers.
How Each Market Type Affects Buyers
In a seller's market, buyers face the most pressure. Homes can receive multiple offers within days of listing, and offer prices frequently exceed the asking price. Waiving contingencies - such as inspection or financing conditions - becomes more common, though doing so carries real financial risk. Working with a knowledgeable agent matters here; see what a buyer's agent actually does for a breakdown of how representation helps in competitive conditions.
In a buyer's market, the dynamic flips. You have more time to evaluate properties, and sellers are generally more willing to negotiate on price, closing timeline, or repair credits. Overbidding is rare; well-priced offers at or below asking are often accepted.
A balanced market offers the most predictable experience. Offers at fair market value are typically competitive, and both parties can usually negotiate without one side dominating.
| Balanced market threshold | ~6 months of supply (National Association of Realtors general guidance) |
| Seller's market supply level | Under 5 months (Common industry benchmark) |
| Buyer's market supply level | Over 7 months (Common industry benchmark) |
| Key buyer's market signal | Frequent price reductions |
| Key seller's market signal | Multiple offers above asking price |
| Local vs. national data | Always check neighborhood-level stats (National averages can obscure local variation) |
How Each Market Type Affects Sellers
Sellers obviously benefit most in a seller's market - strong demand supports higher listing prices, faster sales, and fewer concessions. But even in a hot market, overpricing a home relative to comparable sales can still cause it to stagnate, which raises buyer suspicion.
In a buyer's market, sellers need to be realistic about pricing from day one. A home priced above what the data supports will accumulate days on market, and a prolonged listing can make buyers wonder what's wrong with the property. Price reductions are common, as are seller-paid closing costs and flexibility on move-out dates.
A balanced market rewards preparation and accurate pricing. Homes in good condition, priced at or near their appraised value, sell reasonably well without requiring significant concessions from either side.
To track these shifts over time, monitoring key market indicators - such as days on market, list-to-sale price ratios, and local inventory trends - gives both buyers and sellers an early read on which direction conditions are moving.
Recognizing Which Market You're In
National headlines about the housing market often mask significant local variation. A city-wide report may describe a seller's market while certain neighborhoods within that city are experiencing softer demand. Always look at data specific to your target area, price range, and property type.
Key signals to watch:
- Days on market (DOM): Low DOM (under 30 days for most markets) suggests seller conditions; high DOM (60+ days) suggests buyer conditions.
- List-to-sale price ratio: Consistent sales above asking price signals a seller's market; repeated sales below asking points to a buyer's market.
- Active inventory: A shrinking supply of listings tightens competition; growing inventory loosens it.
- Price reductions: Frequent reductions are a buyer's market signal; rare reductions indicate seller strength.
If you're deciding between renting and purchasing given current conditions, the analysis in renting vs. buying in a high-price market addresses how market type intersects with the broader rent-or-own decision. Regardless of market conditions, the best outcomes typically come from entering a transaction with accurate data, clear priorities, and realistic expectations.